Further details about our work
The NetWorkshop
BUILDING SOCIAL CAPITAL
Evaluating Collaboratives using Social Network Data:
Measuring networked systems and inter-organizational collaboratives
We use social network analysis and qualitative data to investigate strengths, gaps and opportunities to help individuals, organizations and collaboratives build social capital—defined as key social resources including leadership, belonging, trust, reciprocity, problem solving, advice-giving, knowledge and supportive norms.
Below, we describe what social network analysis is and some examples of how it helps collaboratives make decisions and improve their collaboration.
What are the elements of Social Network Analysis?
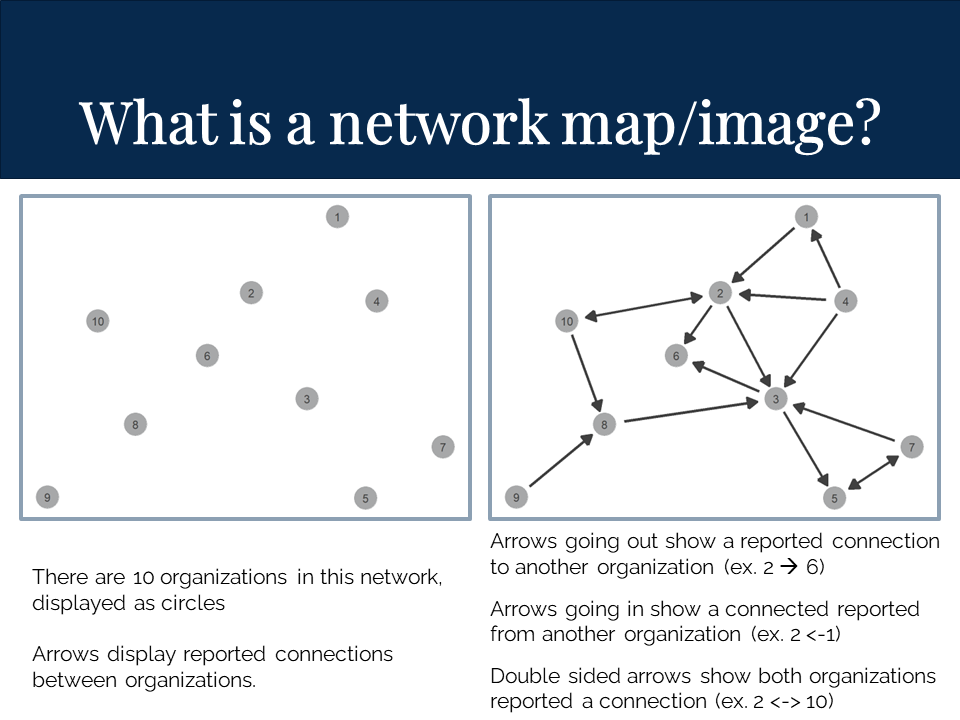
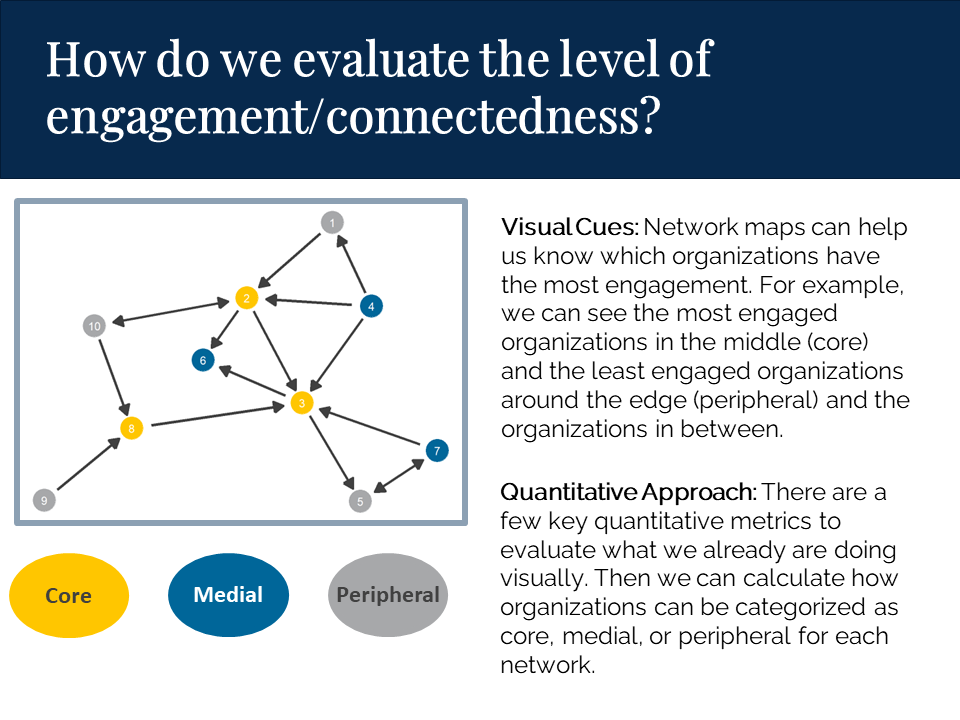
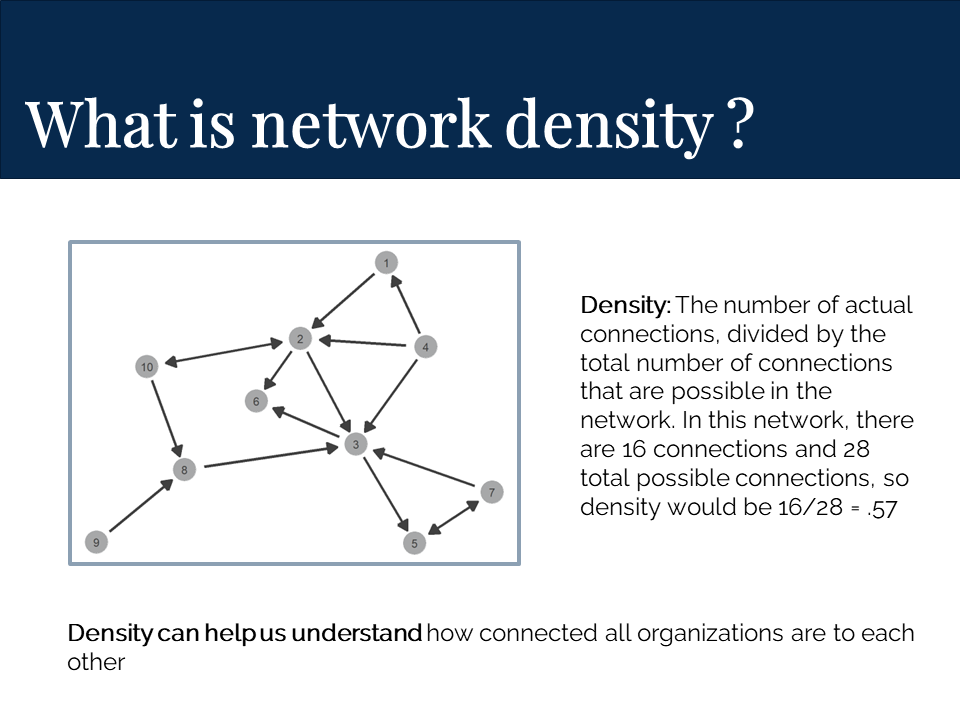
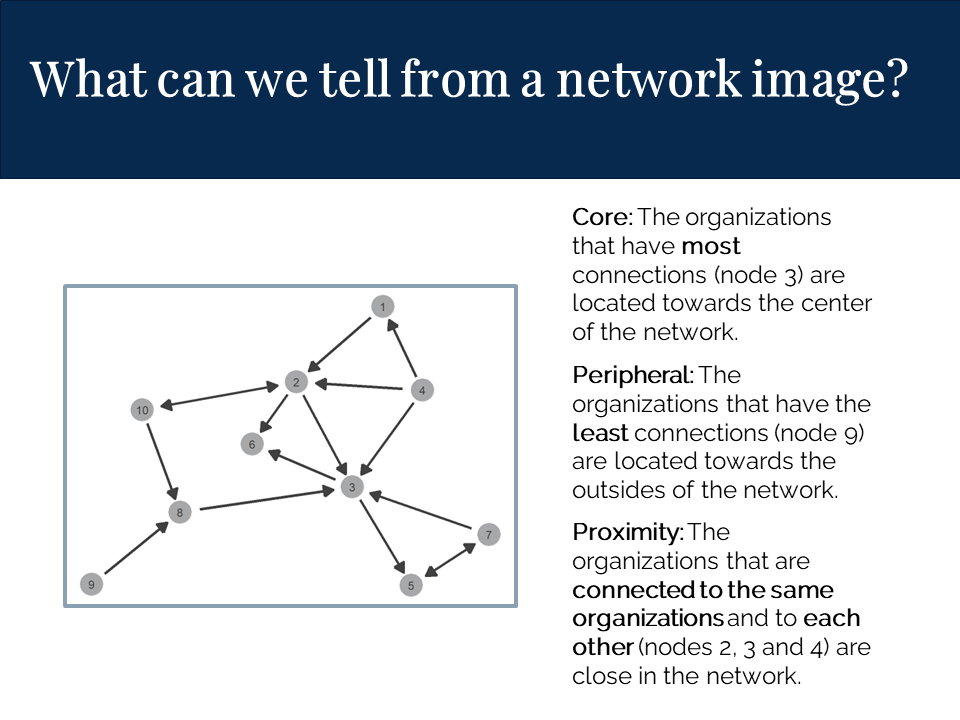
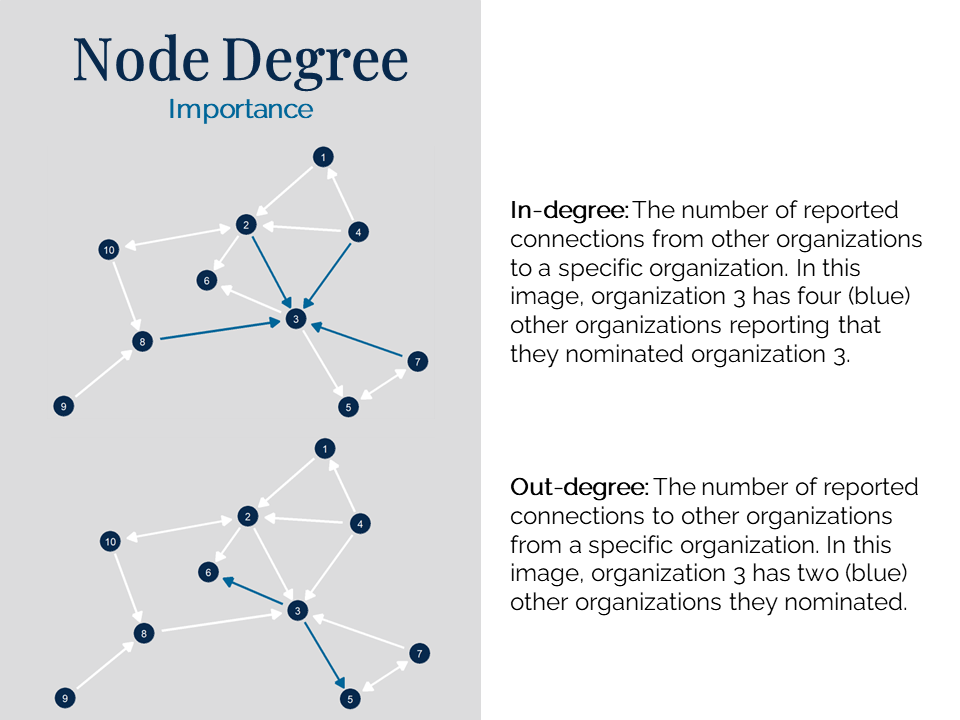
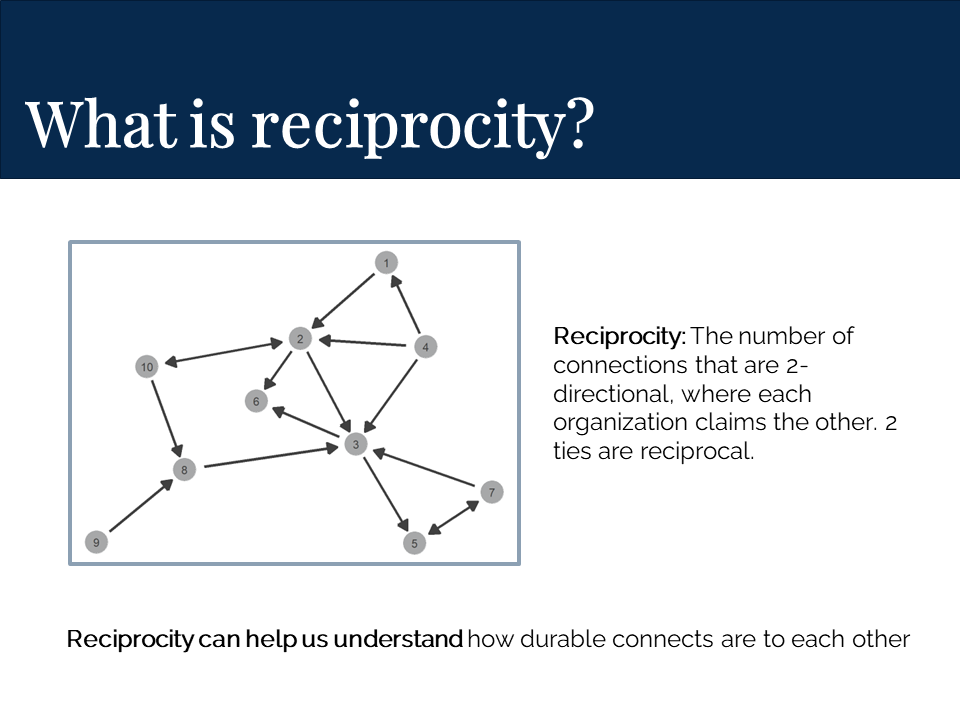
Network Maps: Collaboratives can be visually represented using network analysis. Shapes (called nodes) in the map represent organizations/partners and connections (lines) in the map represent reported connections between organizations/partners.
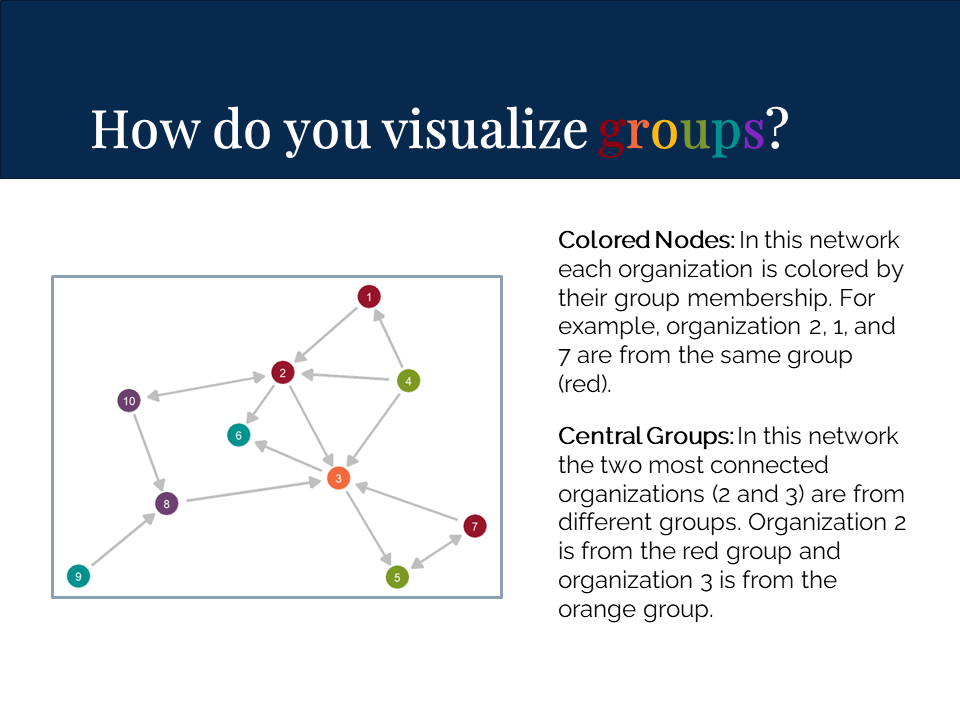
Nodes: Nodes on a map can be different shapes depending on what is most important to the collaborative., for example:
Different shapes: community members as circles, researchers are squares
Different sizes: the organization with the most connections is the biggest size, organization with the least connections is the smallest size
Different colors: different types of organizations, such as non-profits, healthcare organizations or businesses.
Lines: The meaning, direction and thickness of lines on a map can have meaning, for example:
Meaning: We ask each collaborative partner to identify different kinds of connections, based on what is most important to the collaborative. (i.e. resource sharing, referral, care co-ordination, problem solving). We make a separate network map for EACH type of collaboration. For each map, the line will represent a particular kind of connection.
Direction: an arrow pointing from node 1 to node 2, indicating that node 1 claimed node 2 as a collaborator.
Thickness: a thicker line can indicate a stronger/more frequent connection between nodes.
What social network measures do we provide for our collaboratives to identify strengths, gaps and opportunities?